


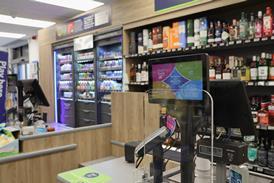
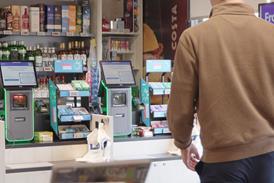


The typical convenience store shopper has only around a third of a second on average to assess a product display in a convenience store, according to HIM.
The company has collected a new wave of data from stores in five different convenience fascias over 35 days, in which every fixture was audited and customers were given eye-tracking ‘ClipCam’ glasses to record what they saw during their shopping missions, yielding information on 424,000 point of purchase interactions. It revealed that the average browsing time for shoppers in a c-store was three minutes 51 seconds, during which time they would pass 606 individual product category displays, an average of 0.3 seconds per display.
The huge project, which for the first time evaluates the effectiveness of fixture displays in the convenience sector, was initiated by HIM and POPAI, the UK trade association promoting best practice in point of purchase and in-store display solutions, to assess the unique challenges faced by suppliers and retailers to create effective in-store displays in the convenience sector, where the average shopper spends less than five minutes per visit, compared to 38 minutes in a supermarket.
Presenting the initial findings, Charles Whitehead, head of client services at HIM, said: “It takes 0.9 seconds to take in what’s in a display, but shoppers are only spending an average of 0.3 seconds, so it is impossible for them to notice everything in a c-store. Therefore it is important to create the right level of display to engage with shoppers on a particular mission. On average, they will only look at 54 displays (out of 606) on each visit.”
The data analysis showed the percentage of displays that had impact, engagement, conversion (i.e. led to physical sales) or had ‘lost’ sales (i.e. when the shopper engaged with the fixture but didn’t actually purchase). These ratios varied according to product category, and correlated most closely depending on the mission the shopper was on.
For example, one in six shoppers on an ‘entertaining’ mission were impacted by a display of relevant products, and the rate of conversion among those who engaged with a display was higher for those on a distress top-up mission than the average store visitor. The study also found that adding ‘theatre’, such as character graphics or seasonal accompaniments, to a display created twice the conversion rate than a stack of products alone.
No comments yet